Short answer: ABC analysis ranks the items in your shop by the money they use in a year: yearly units sold × purchase cost. A small group of A items usually takes 70–80% of the value, B items take the next 15–25%, and a long list of C items takes the rest. Watch A items closely, B items regularly and C items lightly.
This guide is for kirana, general, pharmacy, cosmetics, hardware and other retail shops in India that want to spend less time on stock and still keep a tight hold on it.
How to do it in five steps
- List every item with its units sold in the last 12 months.
- Find the yearly value of each item: units × purchase cost. Use cost excluding the GST you claim back as input tax credit.
- Sort the list from the highest yearly value to the lowest.
- Work out each item's share of the total and add the shares down the list to get a cumulative percentage.
- Draw the lines: items up to about 75–80% cumulative are A, up to about 95% are B, and the rest are C.
Worked example: a kirana with ₹20 lakh of yearly purchases
Ten items are used to keep the example short. A real shop will have hundreds, but the method is the same.
| Item | Units × cost | Yearly value | Share | Cumulative | Class |
|---|---|---|---|---|---|
| Rice (25 kg bag) | 350 × ₹2,000 | ₹7,00,000 | 35% | 35% | A |
| Edible oil (15 L tin) | 250 × ₹2,000 | ₹5,00,000 | 25% | 60% | A |
| Atta (10 kg bag) | 750 × ₹400 | ₹3,00,000 | 15% | 75% | A |
| Toor dal (1 kg) | 1,000 × ₹160 | ₹1,60,000 | 8% | 83% | B |
| Sugar (1 kg) | 3,500 × ₹40 | ₹1,40,000 | 7% | 90% | B |
| Detergent powder (1 kg) | 1,000 × ₹100 | ₹1,00,000 | 5% | 95% | B |
| Biscuits (packet) | 4,000 × ₹10 | ₹40,000 | 2% | 97% | C |
| Spices (100 g pack) | 600 × ₹50 | ₹30,000 | 1.5% | 98.5% | C |
| Matchboxes (pack of 10) | 1,000 × ₹20 | ₹20,000 | 1% | 99.5% | C |
| Incense sticks (pack) | 250 × ₹40 | ₹10,000 | 0.5% | 100% | C |
| Total | ₹20,00,000 | 100% |
| Class | Items | Share of items | Yearly value | Share of value |
|---|---|---|---|---|
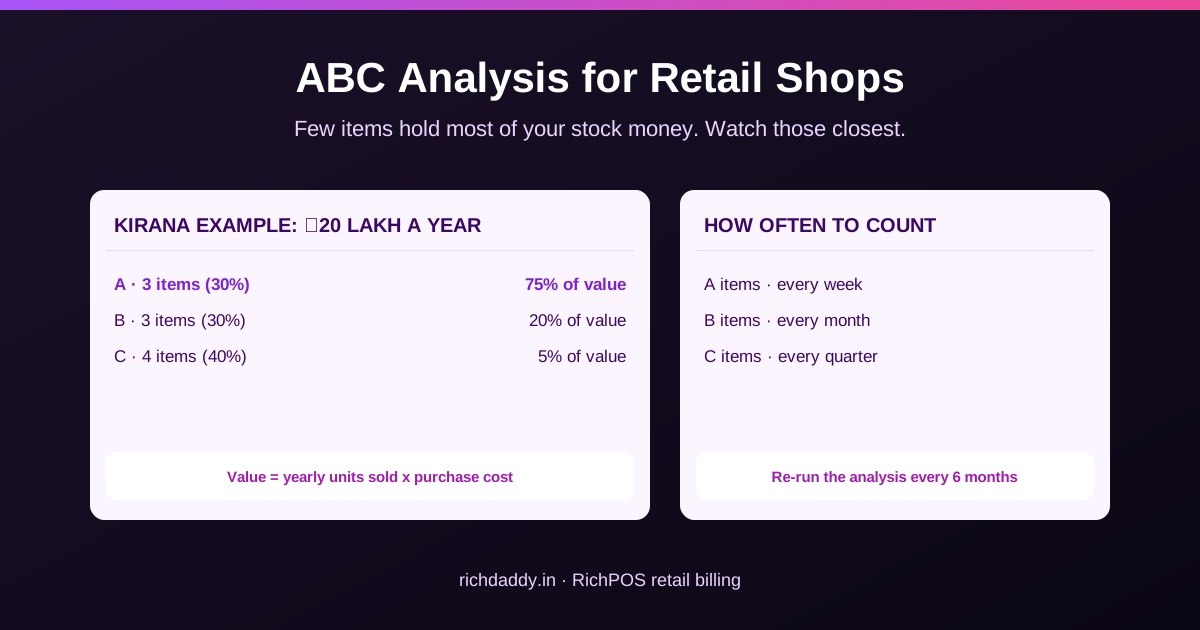
| A | 3 | 30% | ₹15,00,000 | 75% |
| B | 3 | 30% | ₹4,00,000 | 20% |
| C | 4 | 40% | ₹1,00,000 | 5% |
Three items out of ten carry three-quarters of the money. A one-day stock-out or a 2% price rise on rice, oil or atta hurts far more than the same problem on incense sticks.
What to do with each class
| Task | A items | B items | C items |
|---|---|---|---|
| Physical count | Every week | Every month | Every quarter |
| Reorder | Small, frequent orders with set reorder levels | Regular orders, reviewed monthly | Larger, less frequent orders |
| Supplier talks | Compare rates, ask for schemes and credit days | Check rates twice a year | Buy from whoever is convenient |
| Safety stock | Low but watched closely | Moderate | Can be generous; the money involved is small |
A physical stock count of only the A list takes minutes and covers most of your stock value. Set low-stock alerts on A items first, and send purchase orders for them on a fixed day each week.
Combine ABC with movement
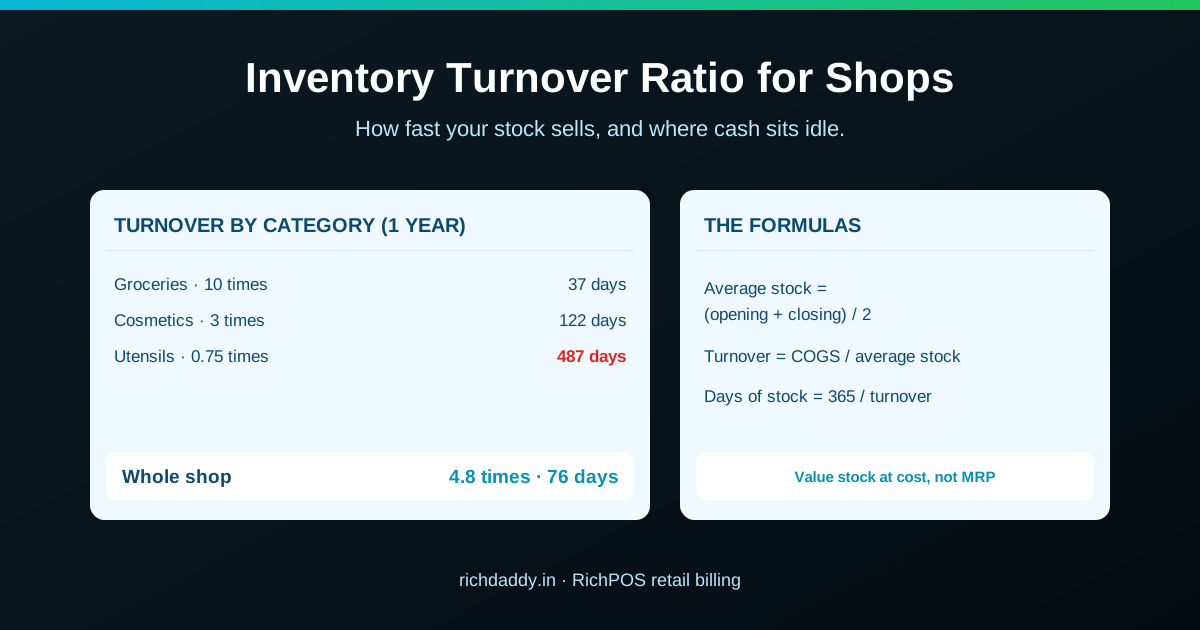
ABC looks only at value. An A item that moves slowly is the costliest problem in the shop, because a lot of money waits a long time on the shelf. Check the inventory turnover of each A item, and look for items that have not sold at all in 90 days before they turn into dead stock.
Common mistakes
- Ranking by selling price or MRP instead of purchase cost.
- Ranking by units sold alone. Biscuits sell the most packets here but are a C item by value.
- Dropping C items that customers expect to find, and losing the bigger basket that comes with them.
- Doing the analysis once and never again. Seasons, new brands and price changes move items between classes.
Frequently asked questions
- What is ABC analysis in inventory?
- ABC analysis sorts your stock items by how much money they use in a year. A items are the few that take most of the value, B items are in the middle, and C items are the many small ones. It tells you where to spend your time on counting, reordering and supplier talks.
- How do I do ABC analysis for my shop?
- For each item, multiply the units sold in a year by the purchase cost to get its yearly value. Sort items from highest to lowest value, work out each item's share of the total, and add the shares cumulatively. Items up to about 75–80% cumulative are A, the next 15–20% are B, and the rest are C.
- What percentage is used for A, B and C?
- A common split is A up to 70–80% of value, B the next 15–25%, and C the last 5–10%. These are guidelines, not rules. Pick cut-offs that give you a short A list you can actually check every week.
- Should I stop stocking C items?
- Not automatically. C items are low in value, but some, like matchboxes or small packs, bring customers in or complete a purchase. Keep them, buy them less often in sensible quantities, and spend less time counting them.
- How often should I redo ABC analysis?
- Every six months is enough for most shops, and also before a big season such as Diwali or a wedding season, because the items that make up the A class change with demand.
- What is the difference between ABC analysis and FSN analysis?
- ABC analysis ranks items by yearly value. FSN analysis ranks them by how often they move: fast, slow or non-moving. Using both together shows you costly items that are also slow, which is where cash gets stuck.
Bottom line: Yearly value = units sold × purchase cost. Sort, add up, and split into A, B and C. Count and reorder A items every week, B items every month and C items every quarter, and redo the split every six months. RichPOS records purchases, sales and stock by item and category, so the yearly figures are ready when you need them. Read the inventory management guide next, call +91 90333 31255, or start the 30-day free trial from the pricing page.